Phasing the rows manually
1. Click the interactive phase correction icon in the top symbolic menu bar.
2. Position the cross hair cursor on a diagonal peak near the top of the spectrum and then click the right mouse button. From the sub-menu that appears, click the add option.
3. Repeat step 2 for a prominent row near the center of the spectrum and for a prominent row near the bottom of the spectrum.
4. Click on the blue R icon in the data window. You should now see the three rows you have chosen on the screen with a vertical red cursor on the largest peak.
5. Click and hold down the left mouse button on the 0 icon in the data window. While holding down the left mouse button, drag the mouse up and down until the resonance at the red cursor is in phase. (Remember that for the NOESY spectra of small molecules the diagonals and off-diagonals should be opposite in phase).
6. Click and hold down the left mouse button on the 1 icon in the data window. While holding down the left mouse button, drag the mouse up and down until the resonances away from the red cursor are in phase.
7. Click the save and return icon in the data window. You will be returned to the NOESY spectrum and the rows will now be phased.
Phasing the columns manually
8. Click on the blue C icon in the data window. You should now see the three columns you have chosen on the screen (displayed horizontally) with a vertical red cursor on the largest peak.
9. Click and hold down the left mouse button on the 0 icon in the data window. While holding down the left mouse button, drag the mouse up and down until the resonance at the red cursor is in phase. (Remember that for NOESY spectra of small molecules the diagonals and off-diagonals should be opposite in phase).
10. Click and hold down the left mouse button on the 1 icon in the data window. While holding down the left mouse button, drag the mouse up and down until the resonances away from the red cursor are in phase.
11. Click the save and return icon in the data window. You will be returned to the NOESY spectrum and the columns will now be phased.
12. Click the return icon to exit the interactive phase correction routine.
Rather than phasing the rows manually, you can also phase them automatically by doing the following: (note that you will usually achieve better phase correction by phasing manually)
Phasing the rows automatically
1. Click on the ProcPars tab and under phase correction make sure that PH_mod is set to pk in both the F2 and F1 domains.
2. Click the Spectrum tab to return to the spectrum.
3. You can autophase the rows by typing calcphhomo.
4. Type xfb to Fourier trannsform you data. The rows should now be phased.
5. Phase the columns manually as described above.
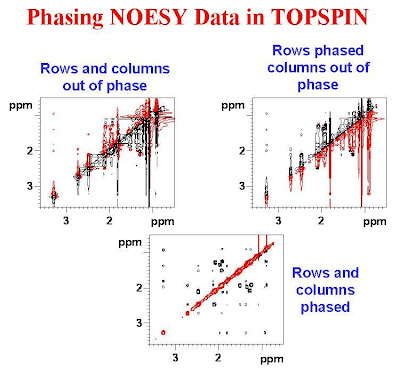
The figure below shows a NOESY spectrum with both the rows and columns out of phase in the top left panel, the rows phased and the columns out of phase in the top right panel and both the rows and columns phased in the bottom panel. In this figure red is negative and black is positive.

1 comment:
Hello. This post is likeable, and your blog is very interesting, congratulations :-). I will add in my blogroll =). If possible gives a last there on my blog, it is about the Impressora e Multifuncional, I hope you enjoy. The address is http://impressora-multifuncional.blogspot.com. A hug.
Post a Comment